Simplifying Elemental Mapping, from Lithium to Uranium
THE CHALLENGE
As today’s industries strive to improve efficiency and performance while reducing costs, innovative new materials are being tested, developed, and brought to market. From raw material quality control to failure analysis, elemental characterization is a critical part of this lifecycle. Despite its importance, performing elemental characterization is difficult and time-consuming, requiring multiple analytical instruments, complicated operational and calibration procedures, and trained chemists. Traditional mass spectrometry and spectroscopy techniques involve digesting solid material with acid for the most accurate elemental analyses. This results in a bulk composition of the material only and fails to identify how elements change spatially or in depth. Investigating elements’ spatial distributions is especially critical for diagnosing failures in the manufacturing process or after use.
To access spatial elemental data, some users combine mass spectrometry techniques with laser ablation instruments. Due to the complexity of each part of the combined laser ablation and spectroscopy system and lack of continuity between different configurations and vendor combinations, there are still numerous challenges in data collection and processing.
Another approach is to apply scanning electron microscopy with energy dispersive x-ray spectroscopy (SEM-EDX). This can be easier to use than other spectroscopy tools that require liquid sample introduction, but it does not provide high-sensitivity elemental results. SEM-EDX delivers some elemental mapping information, but it can investigate small samples only.
MASSBOX
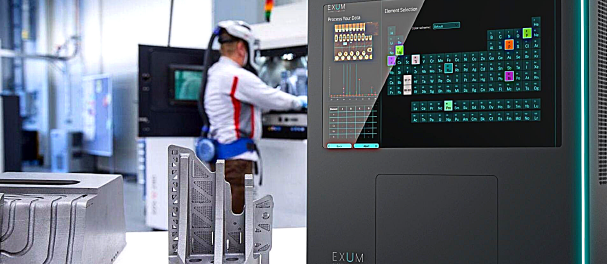
The Massbox's Laser Ablation Laser Ionization Time of Flight Mass Spectrometry (LALI-TOF-MS) addresses many challenges associated with other analytical techniques to offer rapid, high-sensitivity quantification of nearly the entire periodic table. The ionization source, LALI, uses two lasers to first ablate, or release, material from a solid sample’s surface and then ionize neutrals present in the ablated material. The laser ablation process allows direct analysis of solid materials, from feedstock to final product, without the complicated sample preparation procedures of other techniques that require liquid sample introduction.
The ionization laser targets the neutral particles created by ablation, which are more representative of the sample’s constituents than plasma-generated ions. Overall, LALI results in more reliable elemental verification and reduces sample matrix effects. After ionization, the TOF mass analyzer creates a full mass spectrum at each laser spot. Based on the naturally occurring isotope patterns, the software verifies each detected element.
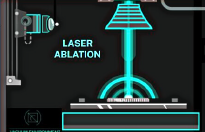
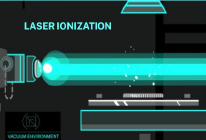
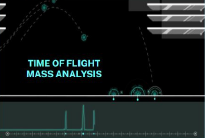
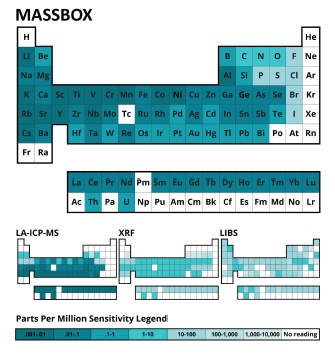
Figure 1: A) Ablation laser fires perpendicular to the sample's surface. The laser spot size is adjustable from 5-200 micron; B) Secondary laser performs multiphoton ionization of neutral particles created by ablation process; C) Ions are separated by Time-of-Flight mass spectrometry and detected with an multichannel plate (MCP)
Figure 2: Detection limits for Massbox, LA-ICP-MS (Laser Ablation Inductively Coupled Plasma Mass Spectrometry), XRF (X-Ray Fluorescence), and LIBS (Laser Induced Breakdown Spectroscopy). Each element is colored by its respective limit of detection. Darker colors represent lower detection limits.
ELEMENTAL MAPPING
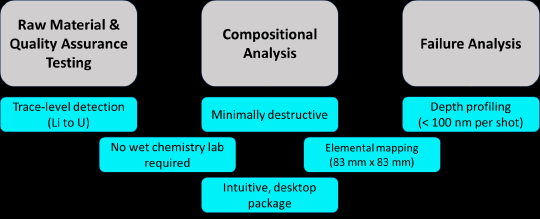
In addition to bulk characterization, the Massbox performs elemental mapping. In each analytical session, it can analyze an area up to 83 mm by 83 mm. The resulting map’s spatial resolution is determined by the ablation laser’s spot size, which is adjustable from 5-200 microns. Each laser spot contains a full mass spectrum of data, and the resulting map reveals the variation of any element of interest. Figure 3 shows an example set of maps from analyzing a LLZO solid-state electrolyte sample. On the map, each pixel is a 50-micron laser spot and the color scale indicates the relative concentration of the elements. Brighter blues are higher concentrations and darker blues are lower. Figure 3 shows the maps of two major matrix elements, zirconium (Zr) and lanthanum (La). Within the wedge shape of the sample, these elements have generally high concentrations, with the exception of several defects with lower concentrations.
CHEMICALLY DIAGNOSING DEFECTS
To investigate a defect’s composition, the user creates a second, smaller analysis over the area of interest. Figure 4 shows a set of maps resulting from a 3.5 mm by 4.5 mm scan over the top part of the sample. The yellow arrow indicates the defect with very low concentrations of the matrix elements, Zr and La. The smaller maps reveal high concentrations of lithium oxide (LiO) and several metallic elements such as chromium (Cr), copper (Cu), and iron (Fe).
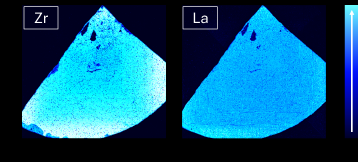
Although this example is perhaps niche for the battery industry, the same process can be applied to investigate uneven elemental distributions across any solid material. The Massbox can generate smaller, lower resolution maps in minutes or larger, higher resolution maps (like those in Figures 3 and 4) in a few hours.
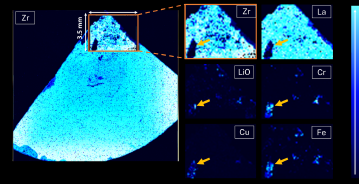
Figure 4: Mapping results acquired with a second scan over the sample’s top portion to investigate the defect’s composition. The smaller analytical area is 4.5 mm by 3.5 mm with a 75-micron laser spot size. The arrow indicates the defect with low concentrations of matrix elements, Zr and La, and high concentrations of LiO, Cr, Cu, and Fe.
FAILURE ANALYSIS WITH ELEMENTAL MAP DEPTH PROFILES
To understand a failed component, it is important to determine how deep the failure or contamination penetrates. Figure 5 shows an example of repeat analyses over the same sample. This is another LLZO solid-state electrolyte sample which was analyzed with a 14.5 mm by 13.3 mm raster area with a 50-micron laser spot size. The analysis was repeated three times and Figure 5 shows the resulting map of lithium (Li) concentrations. The researchers expected to see Li on the sample’s surface, and this was confirmed with many bright blue areas on the surface map. The researchers also anticipated Li dendrites had formed within the electrolyte below the surface. The second pass demonstrates a decrease in Li concentration compared to the surface map because the sample is a much darker blue. The third pass again shows hot spots of high Li concentration, which may be indicative of dendritic growth within the electrolyte as a result of cycling.
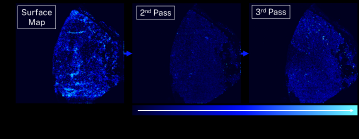
Figure 5: Elemental mapping results from a LLZO solid-state electrolyte sample. The color scale indicates relative concentrations of Li with brighter blues indicating higher concentrations. The same sample area was analyzed three times with a 50-micron laser spot, creating a depth profile.
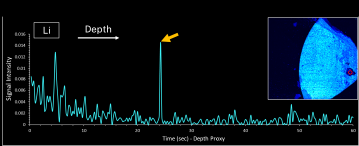
Figure 6: Li signal intensity versus time from a laser spot dwell on a LLZO solid-state electrolyte sample. The red circle on the map in the top right corner indicates the spot’s location. Signal intensity is related to the concentration of Li. Approximately 25 seconds into the dwell, the arrow indicates the laser intersected an abnormally high concentration of Li. For this material, the laser removed ~1.8 micron per second, allowing a depth correlation of the Li spike within the sample.
SINGLE-SPOT DEPTH PROFILES
In addition to repeat elemental mapping, the Massbox also creates depth profiles with single laser spots. Figure 6 shows an example 60-sec laser spot dwell on the same sample in Figure 5. For reference, the top right corner shows a Zr map from this LLZO sample. The red circle indicates the laser spot. Here, the concentration of the major matrix element, Zr, is relatively low, indicating a potential failure area. Figure 6 shows the signal intensity of Li versus dwell time, which represents the concentration of Li in depth. Similar to Figure 5, this graph shows relatively high concentrations of Li at the sample’s surface (time 0) which initially decrease with depth. At ~25 seconds into the dwell, the spike indicates an abnormally high concentration of Li, which could be a lithium dendrite or plating. Because each laser spot includes a full mass spectrum of data, a spot dwell can reveal how any element of interest changes in depth.
The amount of material removed is dependent on the user-defined laser power and material type. For this sample, a microscope measurement showed the laser removed ~1.8 micron per second, allowing a correlation of the Li spike’s occurrence with the depth below the sample’s surface.
SUMMARY
This study demonstrates how the Massbox can help in developing and manufacturing innovative materials and products. Verifying raw materials lays the groundwork to then apply compositional analysis for quality assurance testing throughout manufacturing. For example, a novel product may be analyzed often during the development of its manufacturing line to ensure no quality issues arise. This can involve investigating the full periodic table of elements and oxides for both composition and homogeneity. Further, when working in development, a material quality issue is especially costly when it requires shutting down the manufacturing line to identify the cause of failure. In this case, diagnosing why a component failed quickly is critically important to prevent future failures and resume production. Evaluating the failed component’s chemistry with mapping and depth profiles can help in determining the root cause.


