Lightnovo In-vitro bacteria identification
Introduction
The worldwide increase of antimicrobial resistance (AMR) is a serious threat to human health. To avert the spread of AMR, fast reliable diagnostics tools that facilitate optimal antibiotic stewardship are an unmet need. In this regard, Raman spectroscopy promises rapid label- and culture-free identification and antimicrobial susceptibility testing (AST) in a single step.
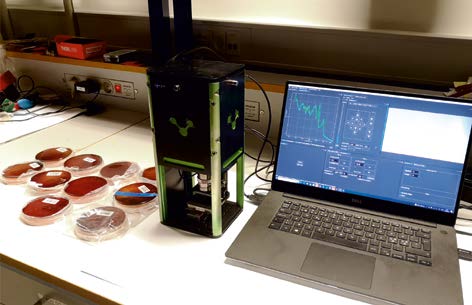
It has been recently shown that multiple bacteria classed can be identified with more than 96% accuracy when machine learning techniques in combination with a novel dataaugmentation algorithm applied.1 Here, we used our miniaturized Raman microscope to measure exactly the same bacteria types as in previous publication, where a research grade Raman microscope with deep cooling CCD was used2 (Figure 1) following identical sample preparation procedures and data analysis (see details in Materials, sample preparation and measurements).
TECHNOLOGY
Raman spectroscopy provides a unique opportunity to study the chemical composition of materials at the microscale. Such capabilities come at the cost of extremely high requirements for instrumentation: lasers with stabilization of wavelength and power, low noise spectroscopic sensors, and a large clear aperture of spectrometer’s optics. Therefore, demanding Raman spectroscopy and microscopy applications usually require high-end, bulky, and costly Raman instrumentation. Lightnovo ApS found possible solutions to the most critical Raman miniaturization challenges: need for laser temperature and power stabilization, reduction of sensor dark noise, compensation on pixel-to-pixel quantum efficiency (QE) variation, laser optical isolation and achieving high spectral resolution.
As result a novel optics miniaturization strategy allows us to create compact Raman spectrometers and microscopes based on non-stabilized laser diodes, densely-packed optics, and noncooled small pixel size sensors.

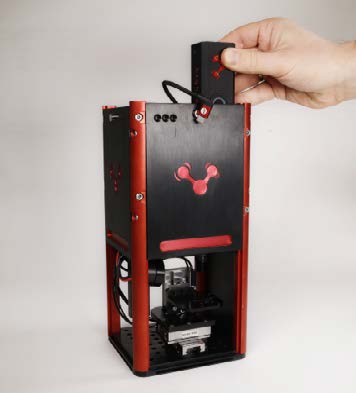
Lightnovo ApS proposed miniaturization concept based on real-time calibration of Raman shift and Raman intensity using an in-built reference channel that collects the Raman spectrum of polystyrene located in the spectrometer. We have demonstrated the miniaturization of the whole device dimensions down to several centimeters and achieved excellent sensitivity, low power consumption, perfect wavenumber and intensity calibration combined with high spectral resolution of around 7 cm-1 within the spectral range of 400-4000 cm-1.
The optical design of our miniaturized Raman spectrometer allows confocal measurements because it utilizes a cross slit confocality concept3 as shown in Figure 2a, 2b. This feature helps to separate out of focus layers, which is beneficial for typical handheld Raman applications where the contribution from sample packaging or glass needs to be minimized. However, cross slit design also allows us to target confocal Raman microscopy applications when the device is additionally equipped with a three-dimensional motorized stage and a white light microscopy module (Figure 2c). The lateral resolution of our miniaturized Raman microscope was tested on polystyrene (PS) beads with a 1μm diameter (Figure 2d). Axial resolution was tested on the surface of a SERS substrate with BPE analyte at a concentration 100μM (Figure 2e). Cross sections in lateral and axial dimensions are represented in Figure 2f. They demonstrate a lateral resolution of around 1μm and an axial resolution of around 2μm, indicating a diffraction limited performance in both dimensions. To the best of our knowledge, the presented miniaturized Raman microscope is the smallest reported confocal Raman system that has been designed without compromising on basic performance.
This feature makes miniRaman technology an ideal solution for materials identification and quantitative measurements.
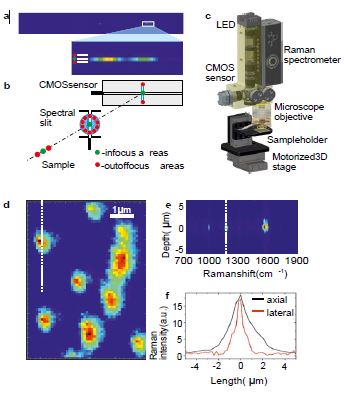
Figure 2. Miniaturized Raman system applied for biomedical Raman microscopy applications. a) image from the CMOS sensor of the SERS signal of BPE; the zoomed region shows that the spectrum is compressed into one row on the sensor; b) illustration of the cross slit design of miniaturized Raman spectrometer that is capable for confocal measurements; c) optomechanical design of miniaturized Raman microscope based on miniaturized Raman spectrometer; d) Raman microscopy image of polystyrene beads at the size of 1μm obtained with Zeiss objective 100x, NA=0.95, exposure time 0.2 sec per point; e) depth scan by our miniaturized Raman microscope (equipped with Zeiss objective 100x, NA=0.95) through the surface of SERS substrate with BPE analyte at concentration 100μM;
f) axial (black curve) and lateral intensity distribution of Raman signal as a function of sample displacement (dotted white lines in Figure 2d, 2e indicate areas used for plotted axial and lateral intensity profiles); data demonstrate diffraction limited spatial resolution.
MATERIALS, SAMPLE PREPARATION AND MEASUREMENTS
The bacteria come from bacterial isolates which were cultured overnight on agar plates, sealed with parafilm and stored at 5 °C until sample preparation. Storage time varied, but was not found to result in spectral changes to strain or phenotype characteristics. All other sample preparation conditions were kept consistent between samples. Test samples were prepared separately from samples used for training, to ensure classification was not influenced by differences in sample preparation. To prepare samples for Raman measurement, a sample was simply transferred from a single colony directly to a sterilized CaF2 Raman-grade objective slide.
Microscopy test on PS beads. PS beads with size of 1μm in the form of aqueous suspension were purchased on Merck (MDL number: MFCD00243243). Suspension was deposited on polished stainless-steel surface for Raman microscopy mapping.
RESULTS
Raman spectra of different bacteria obtained after the averaging of the Raman signal from Raman maps are shown in Figure 3a. In total four Raman maps were collected per single bacteria type: three maps contained regions with individual bacteria, fourth map was collected as a background (Figure 3b). Confusion matrix of bacteria identification built as a result of machine learning data analysis of Raman maps of bacteria is shown in Figure 3c. Data represent a bacteria identification accuracy that is comparable to previously reported results1 (overall classification accuracy 98.6%). However, here we have, thanks to the performance of the spectrometer, been able to reduce the exposure time down to 0.2 sec per spectrum in comparison to 10 sec per spectrum in our previous publication while maintaining comparable or higher SNR of raw Raman spectra of bacteria.
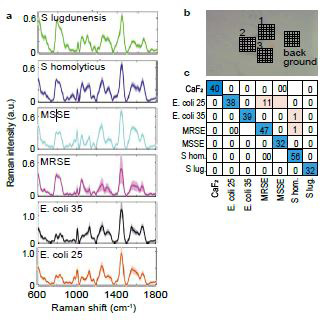
Figure 3. Miniaturized Raman system applied for biomedical Raman microscopy applications. a) Raman spectra of different bacteria obtained after the averaging of the Raman signal from Raman maps;
b) microscopy image of bacteria deposited on CaF2 cover glass with areas selected for Raman mapping of bacteria (areas 1-3) and Raman mapping of cover glass background (areas 4); c) confusion matrix of bacteria identification built as a result of machine learning data analysis of Raman maps of bacteria.
CONCLUSION
Lightnovo ApS demonstrated technology for both miniaturizing and democratizing Raman spectrometers and microscopes, making Raman spectroscopy more accessible to researchers as well as consumers. This application case demonstrates that our miniaturized Raman microscope ideally suits for bacteria mapping application and provides advantages in key Raman microscopy requirements such as LoD, LoQ, mapping speed and mapping resolution, system size and affordability.
LITERATURE
1 Thomsen BL, Christensen JB, Rodenko O, Usenov I, Grønnemose RB, Andersen TE et al. Accurate and fast identification of minimally prepared bacteria phenotypes using Raman spectroscopy assisted by machine learning. Sci Rep 2022; 12: 16436. 2 Kita DM, Miranda B, Favela D, Bono D, Michon J, Lin H et al. High-performance and scalable on-chip digital Fourier transform spectroscopy. Nat Commun 2018; 9: 4405. 3 Slipets R, Ilchenko O, Mazzoni C, Tentor F, Nielsen LH, Boisen A. Volumetric Raman chemical imaging of drug delivery systems. J Raman Spectrosc 2020; 51: 1153–1159.